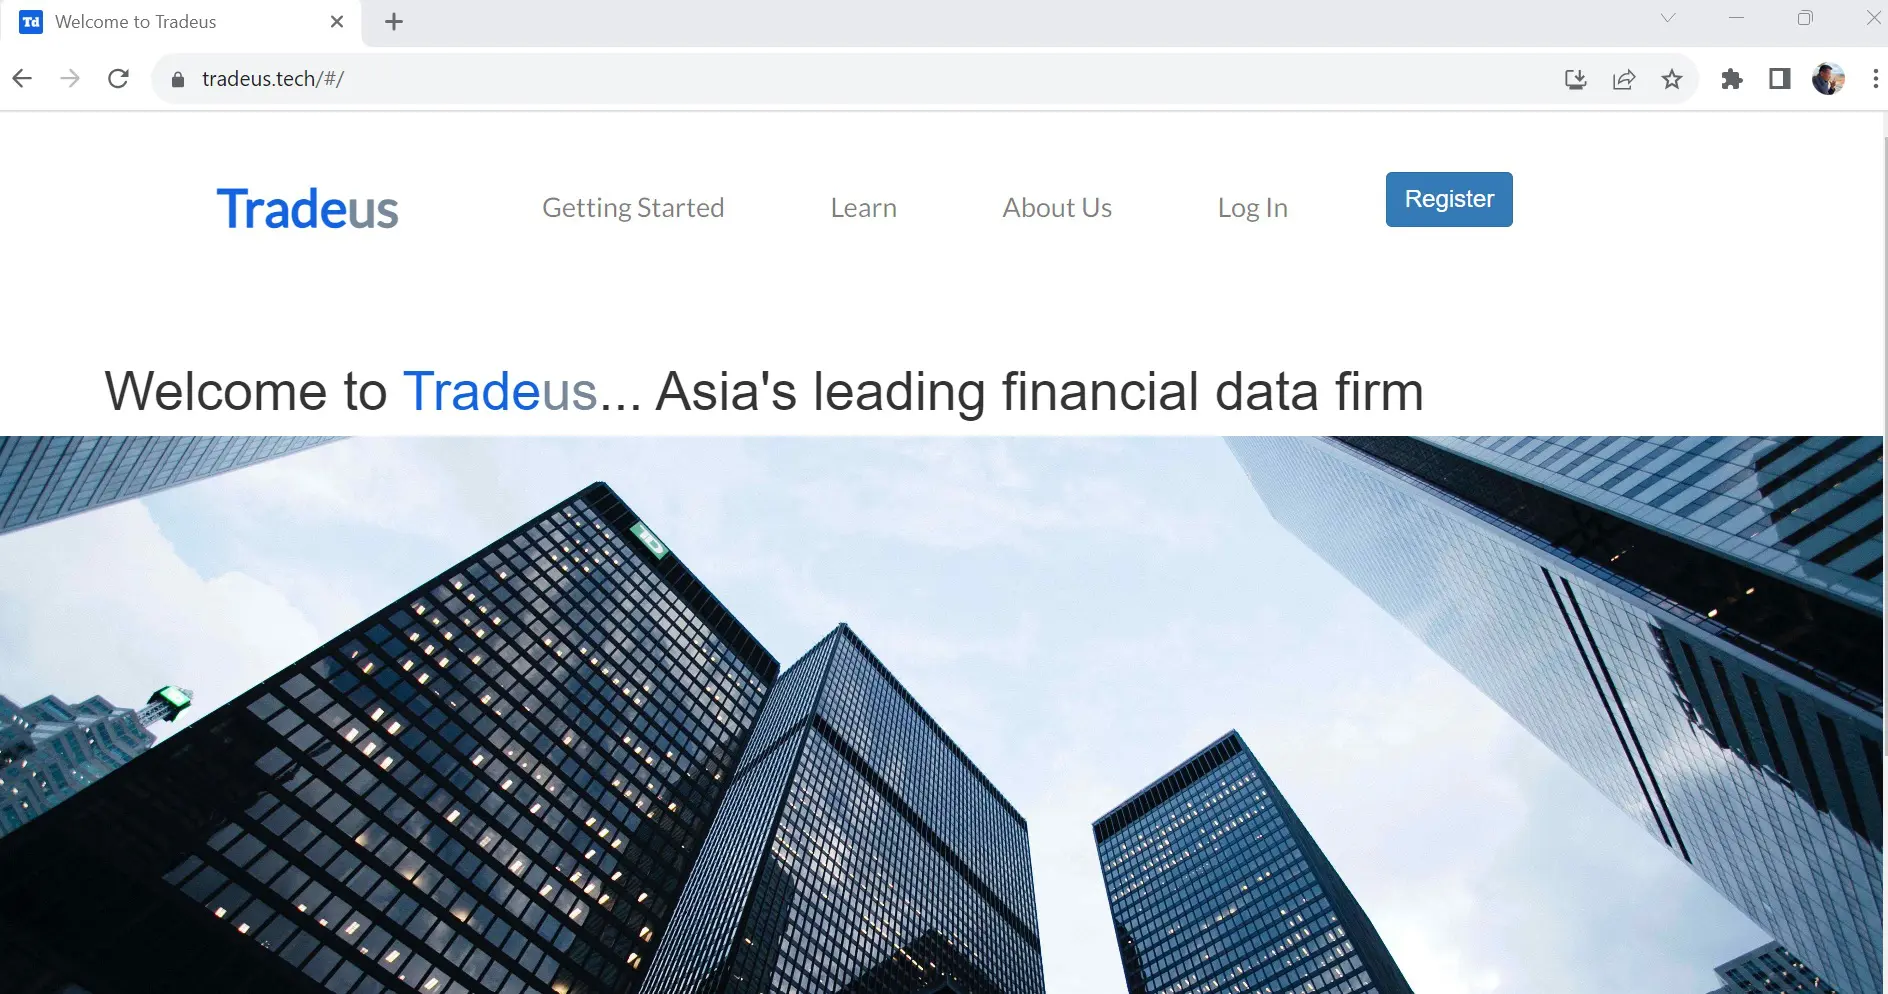
Tradeus is a stock tracker app, with features that distinguishes it from other typical stock tracker apps. It is built with Angular(frontend), Spring Boot (backend) with SQL, Redis and MongoDB as databases. Some exciting implementations in Tradeus include charting, creation of watch list and ability to create personal portfolios which displays real time update of stock profits calculated using both annualised and total profits.
The following list the features implemented and technology used.
Using Tradeus
On log in, users will be directed to the dashboard, which serves as the main page. There are a total of six pages; Dashboard, Research, Portfolio, AISA, Buy Me a Coffee and user-profile edit. The AI-enabled Stock Analytics (AISA) will be rolled out in future implementations.
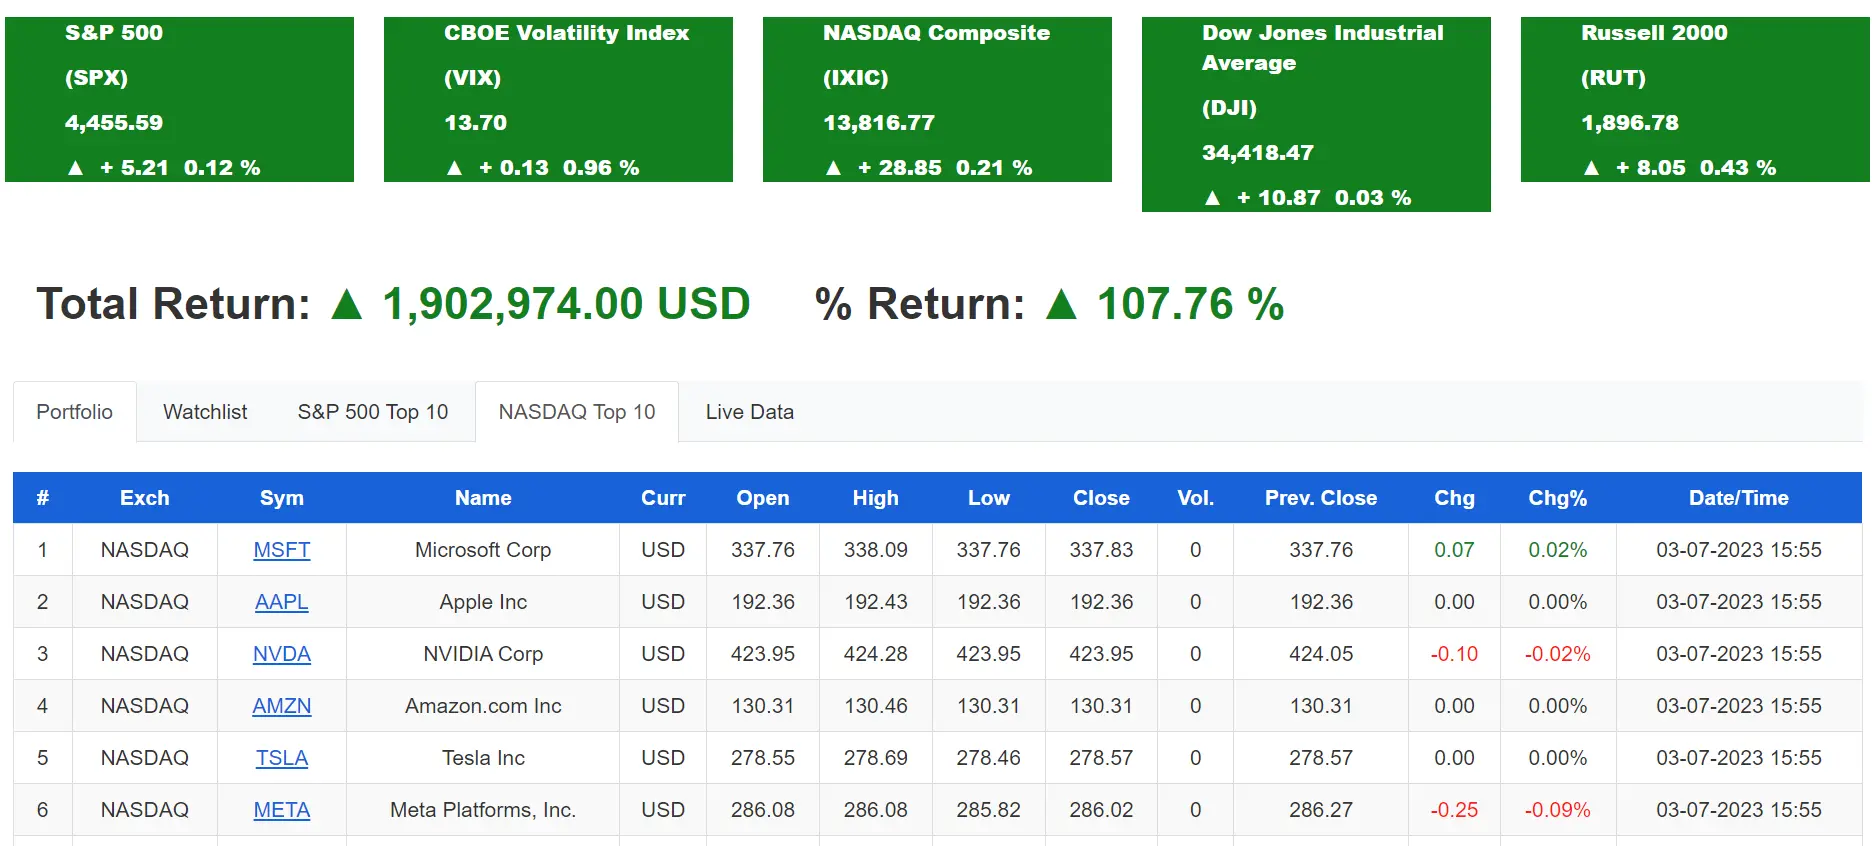
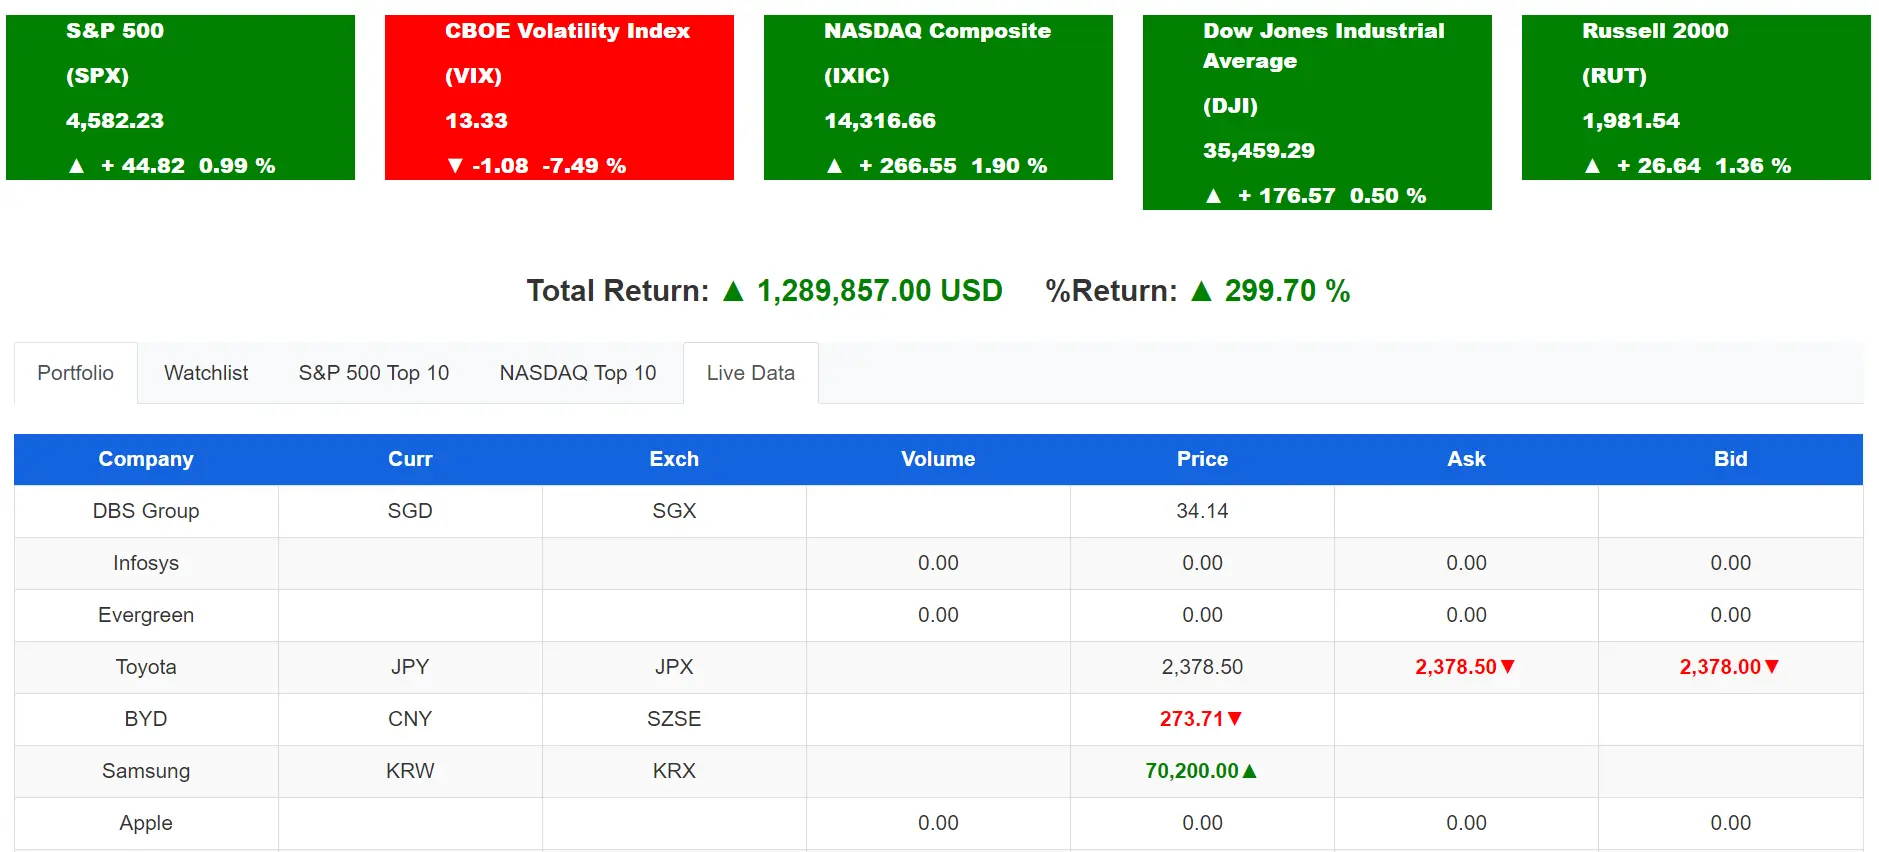
The top provides market data on the S&P 500, Nasdaq, CBOE, DJIA and Russell 2000 indices. There are 5 tabs which provide different lists of stock data:

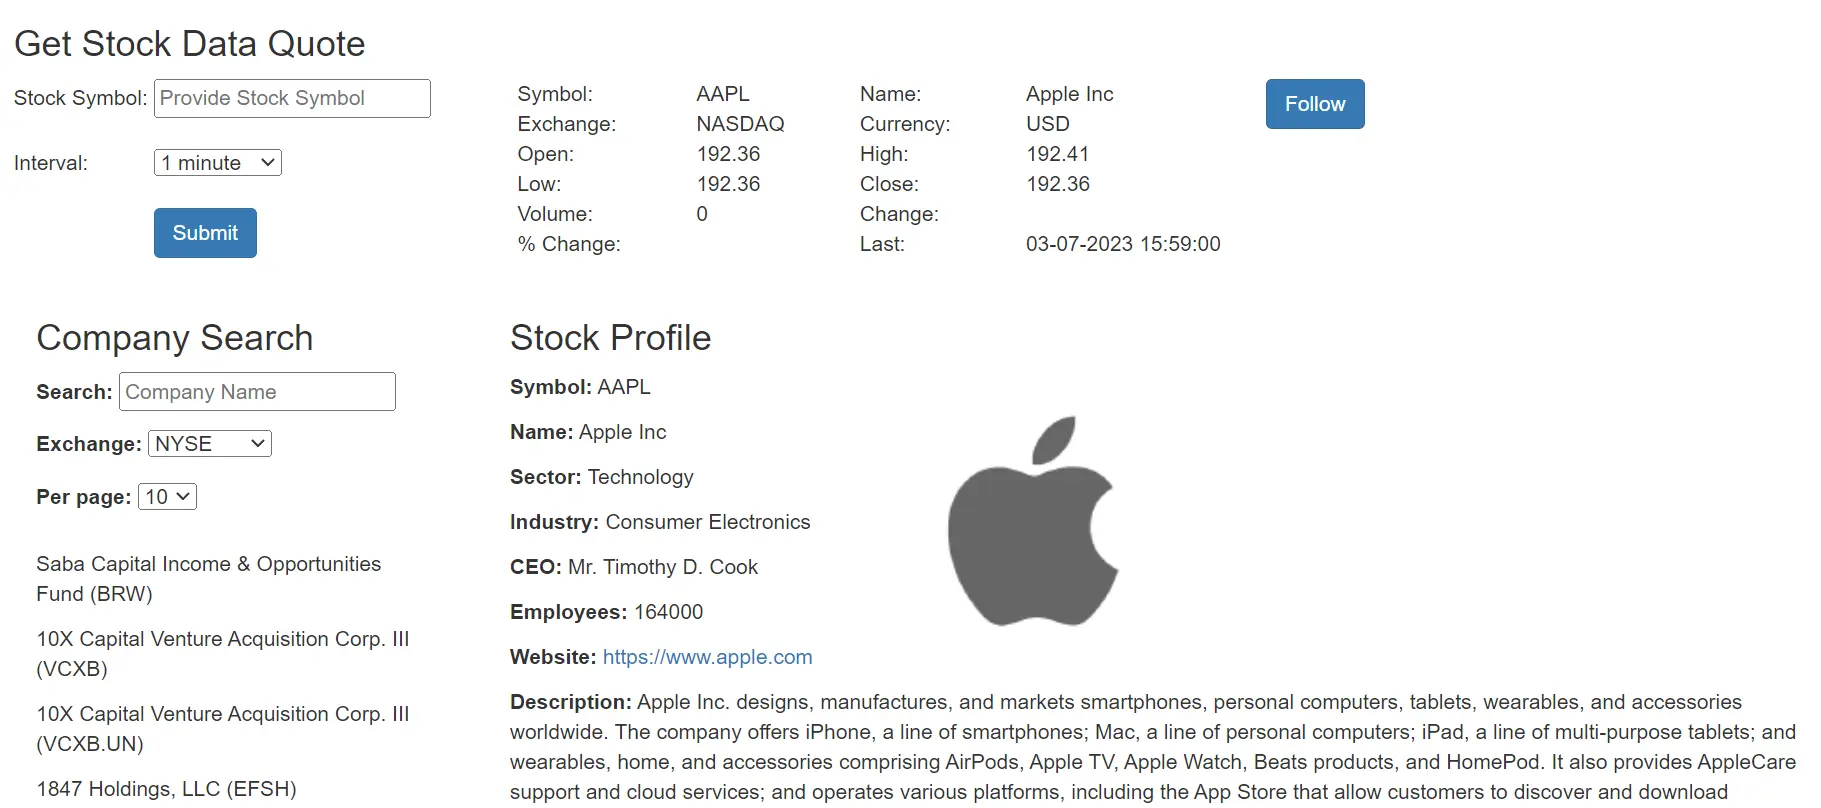
Users can perform search on companies (currently US market) to obtain company profile and recent market performance. Search can be done by entering the name or symbol. Companies can be added to watchlist which is displayed at dashboard.

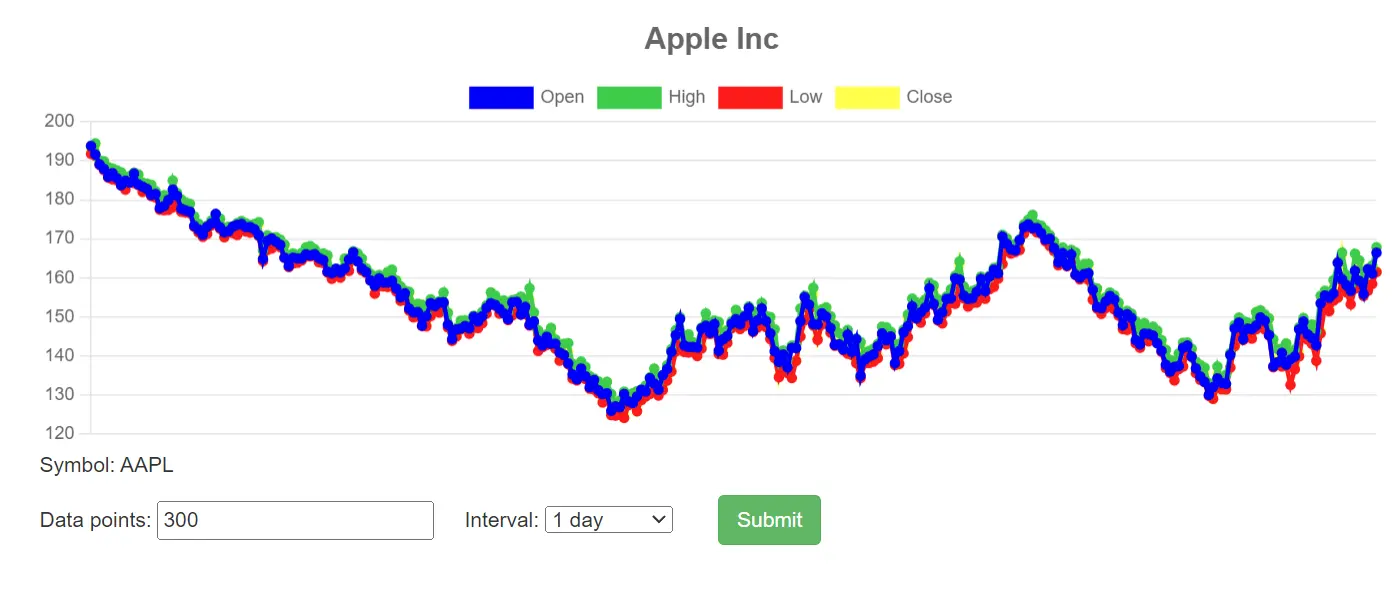
Users can also obtain chart data (OHLC) with data intervals of up to 1 day and 5000 data points.

Users can construct their stock portfolio (currently limited to US stocks). By providing transaction price, number of units, date of transaction and commission (if any), the total and annualised profit will be generated for each stock. Overall value and % profit/loss are displayed as well.

AISA utilises financial data, including historical stock prices, technical indicators market trends and other relevant information. The rollout of AISA is planned for Q4 2023.
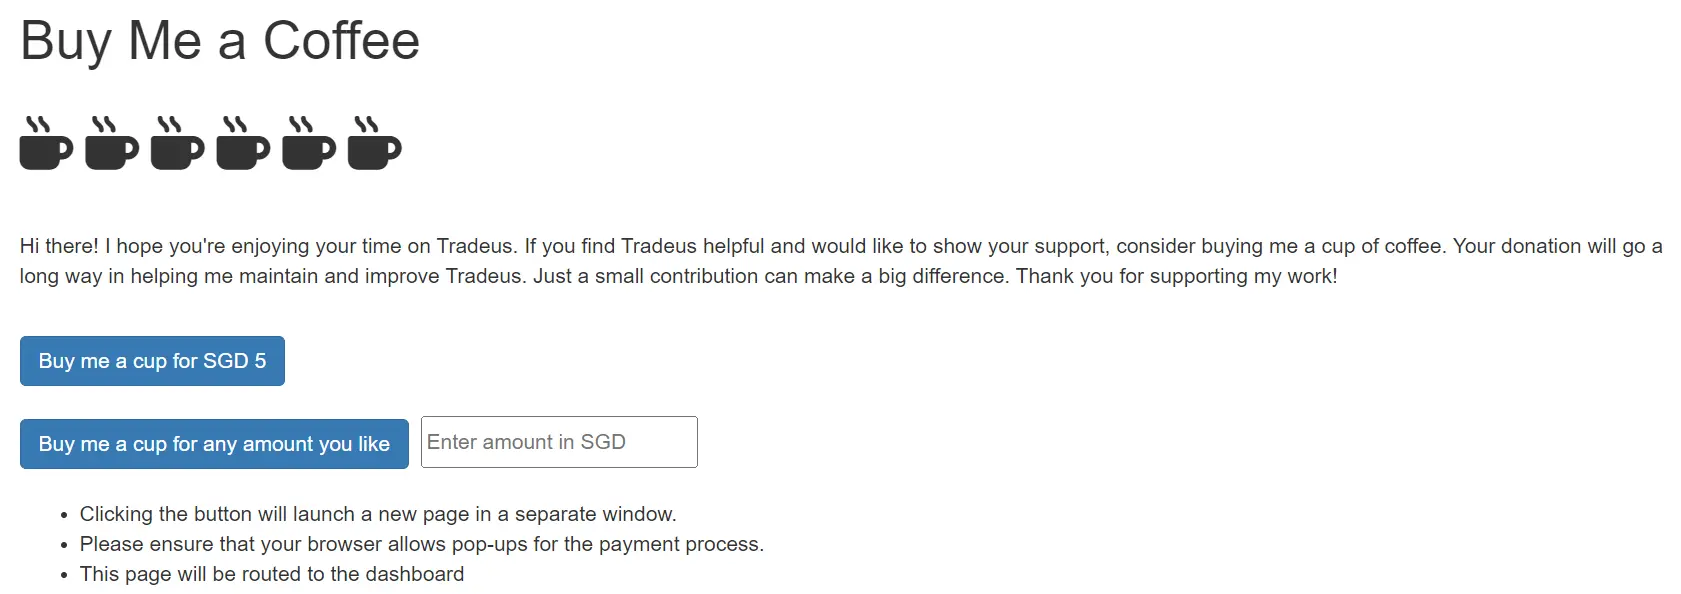
E-payment with Stripe. (Refer to https://stripe.com/docs/testing to make test payment)
For users to edit and save personal details.
Watch the video below to have a better understanding of Tradeus' features.